
By HistoraEDU
A student sees a larger death total and announces that one Civil War prison was worse. Another divides by the camp’s maximum capacity. Both are trying to compare, but neither has yet established what the numbers count. Turn that moment into a short evidence lesson: name the population, name the period, calculate only the measure the source supports, and then write a bounded conclusion.
Start with a question the evidence can answer
Replace a ranking contest with this question: What do these two institutional histories tell us about the proportion of prisoners who died, and what can that comparison not establish? Explain that a percentage describes people’s deaths; it is not a score in a competition. Use non-graphic sources and third-person analysis rather than assigning students prisoner roles.
Give pairs a four-column record headed site, period, people counted and deaths counted. Before using a calculator, students must identify a source for each entry. Missing information stays visibly missing.
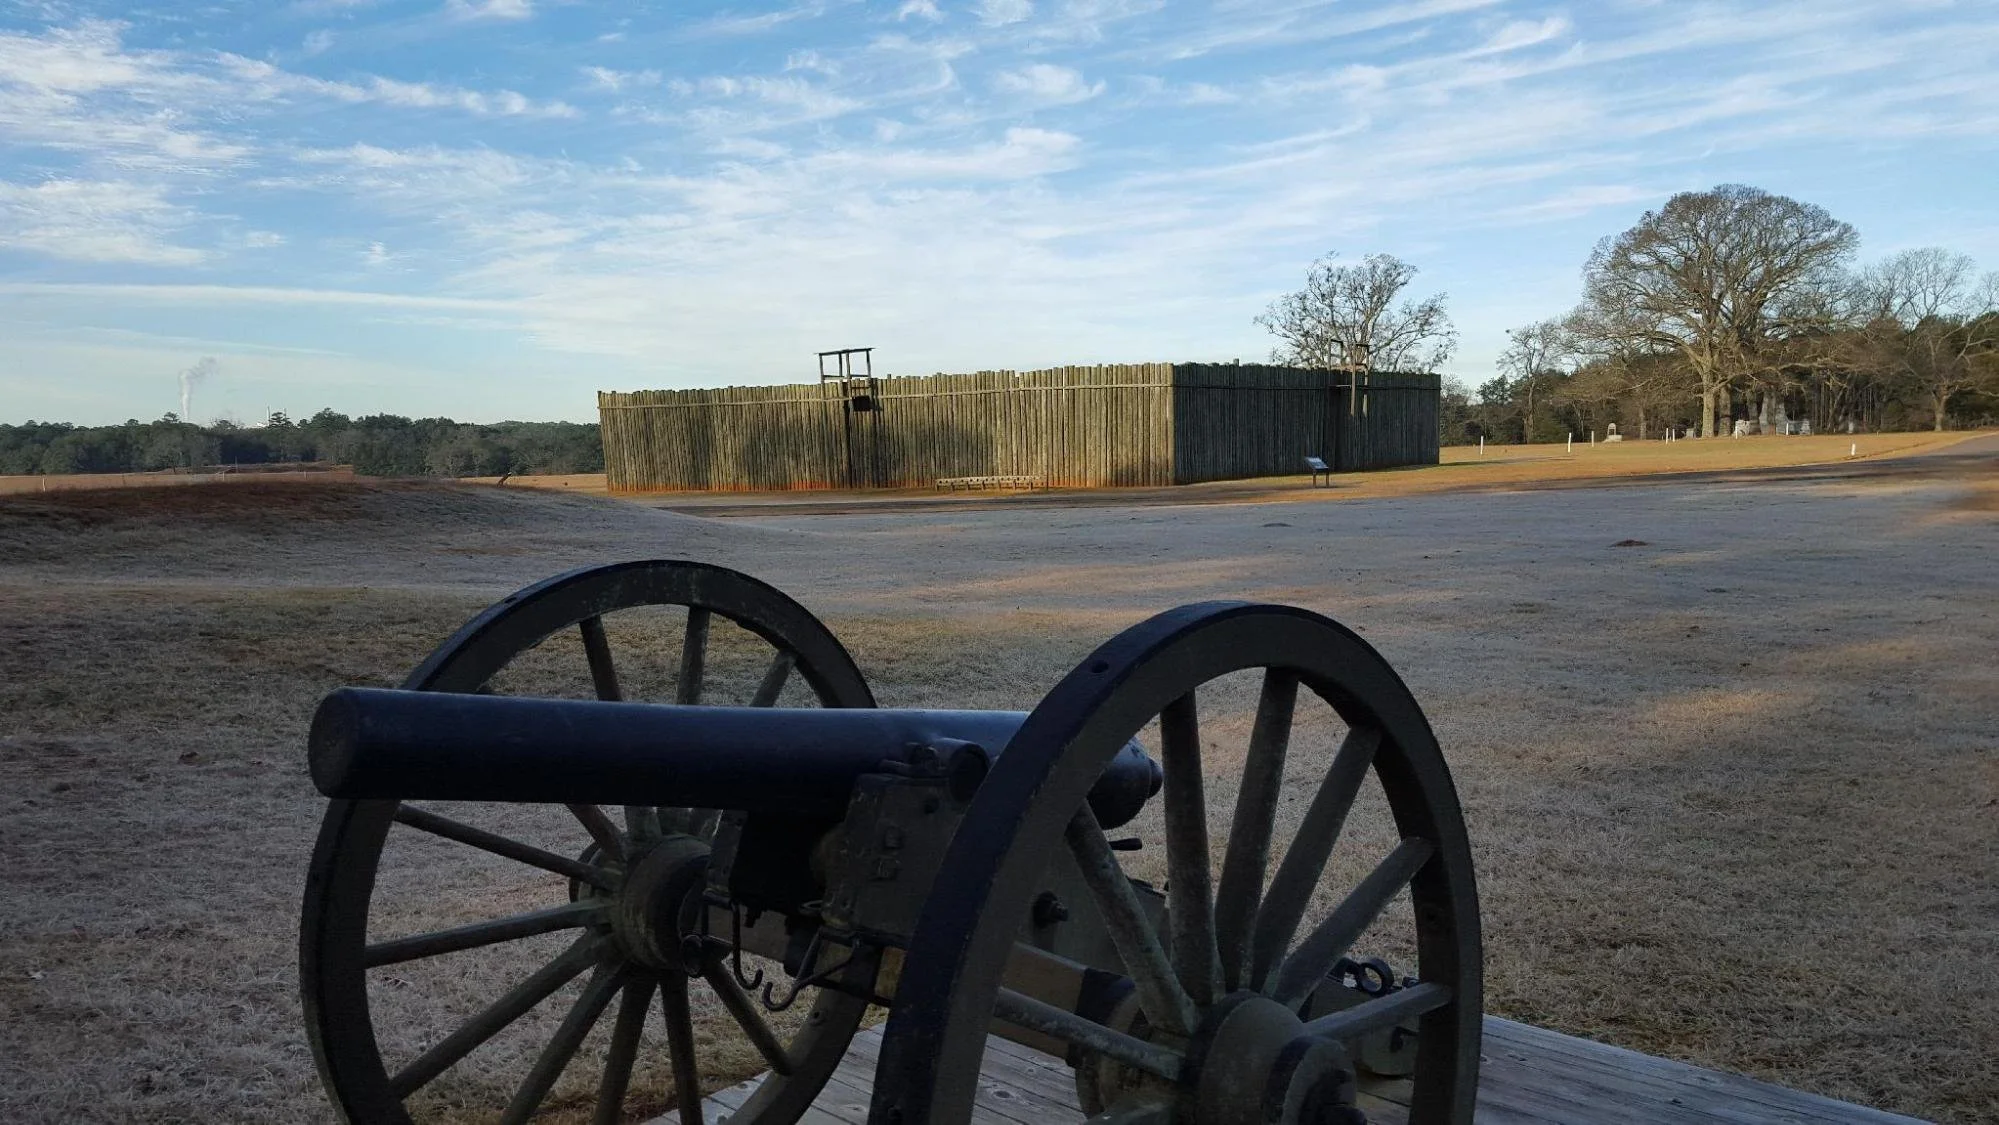
A cannon stands before a reconstructed section of the Andersonville stockade. This is a modern photograph of the historic site, not a wartime photograph. Credit: NPS Photo. No claim to original U.S. Government works. No institutional endorsement implied.
Build two source records before doing the division
For Andersonville, the National Park Service’s overview reports some 45,000 arrivals and 12,920 deaths during the prison’s 14 months. Keep “some” beside 45,000: the starting population is approximate. This is the total arriving across the period, not a simultaneous headcount.
For Elmira, the Department of Veterans Affairs history Federal Stewardship of Confederate Dead, printed page 222, gives July 1864–July 1865, 12,147 prisoners passing through the gates and 2,961 deaths. Label this as that publication’s figures; do not silently combine totals from different summaries.
Students can calculate 12,920 ÷ 45,000 × 100 ≈ 28.7% and 2,961 ÷ 12,147 × 100 ≈ 24.4%. In words, these are roughly 29 and 24 deaths per 100 prisoners counted across the respective reported periods. Rounding does not make an approximate source population exact.
Make the denominator do its job
Now offer three candidate denominators for Andersonville: designed capacity, peak simultaneous population and cumulative arrivals. Ask which describes the people represented by the across-period death total. The NPS overview distinguishes a designed capacity of 10,000, a peak above 32,000 and some 45,000 arrivals. They answer different questions.
A useful student explanation is: “I used cumulative arrivals because my numerator covers deaths across the prison’s existence, not deaths on a single crowded day.” A student who notices the mismatch has done important historical reasoning even before completing the arithmetic.
Then ask what is still missing. Individual prisoners did not all arrive or leave together. The two institutional periods are not identical, and these aggregate figures do not supply each person’s time at risk. Do not divide the percentages by the number of months and label the result a monthly probability. Nor does a difference in percentages, by itself, identify a cause or allocate responsibility.
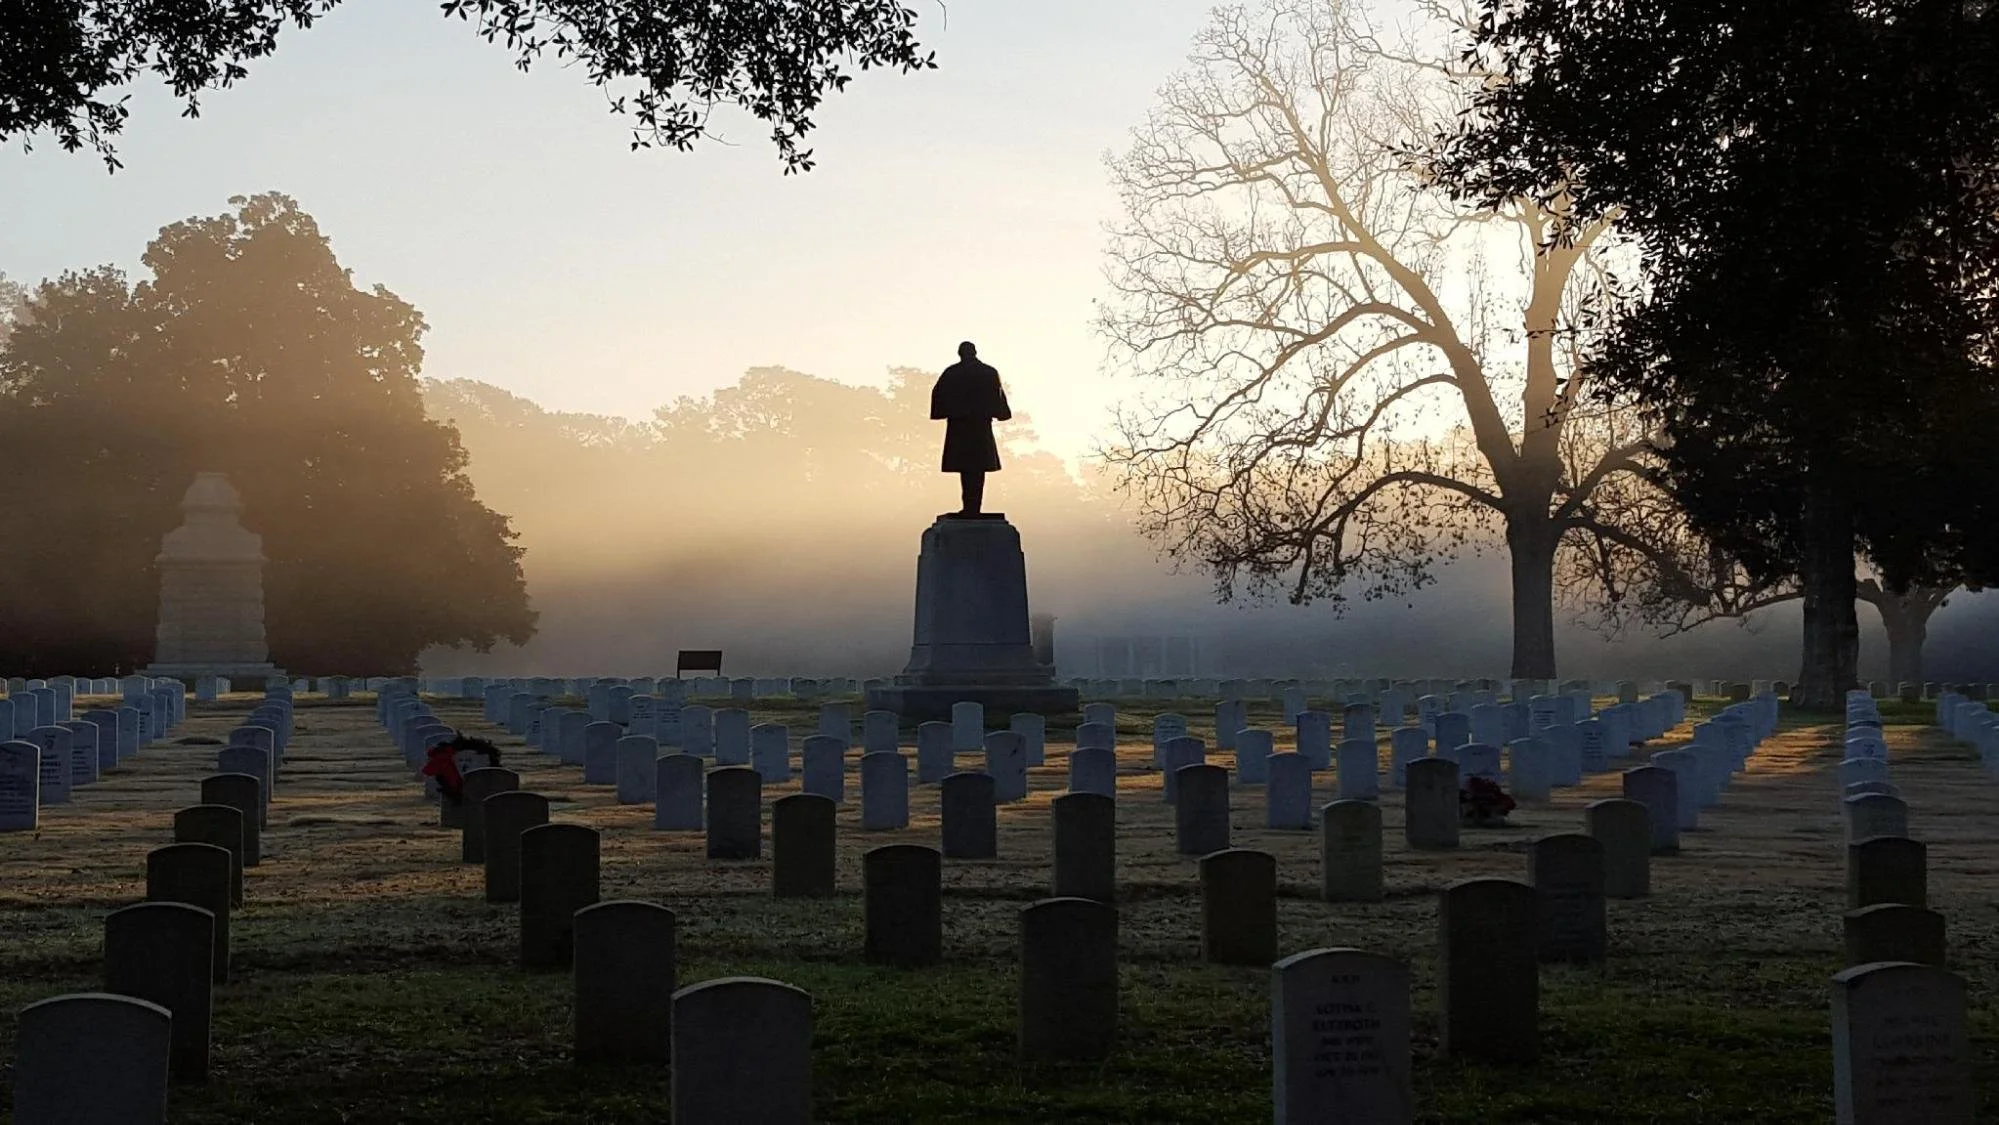
A modern view of Andersonville National Cemetery, with rows of headstones and a soldier monument. This is a place of remembrance, not an image of prison conditions in 1864. Credit: NPS Photo. No claim to original U.S. Government works. No institutional endorsement implied.
Use the cemetery photograph to test a tempting shortcut
Ask whether counting headstones in a present-day cemetery photograph would recover the prison death total. It would not: a photograph has a frame and a date, and the cemetery has a history of its own. The NPS describes later regional reinterments and continued cemetery use. Site, burial population and prison cohort must not be treated as interchangeable.
This is an opportunity to separate commemoration from measurement without dismissing either. The image makes remembrance visible; the named records supply the quantities for this particular calculation.

The National Prisoner of War Museum at Andersonville National Historic Site. The museum interprets American prisoner-of-war experiences beyond the Civil War. Credit: ANDE / Teri Surber. No claim to original U.S. Government works. No institutional endorsement implied.
End with a claim and a limit
An acceptable conclusion is: “Using these sources’ reported totals, Andersonville has the larger approximate across-period proportion of deaths. That comparison is not a matched estimate of an individual prisoner’s risk, and the figures alone do not explain the difference.” Students may then name evidence needed for a separate conditions question, such as dated records of water, shelter, disease or decisions.
For a quick exit check, ask students to correct this original teacher-created statement: “The prison held 45,000 men at once, so that is its maximum crowding.” Look for the distinction between cumulative arrivals and a simultaneous population—not merely replacement of one number.
The readings below can provide context for the places. Supply the NPS and VA extracts for this numerical activity, and keep the source record alongside students’ calculations. The comparison routine here is an original teacher extension, not a claim that the worksheets contain this paired dataset.
Civil War Prison Camps | Reading Comprehension Worksheet

View this HistoraEDU resource on TPT
Use the prison-camps reading as background for identifying the institutions. For the comparison above, provide the separate VA and NPS source records and ask students to label populations and periods before calculating.
Andersonville Prison | Civil War Reading Comprehension Worksheet

View this HistoraEDU resource on TPT
Use for focused Andersonville reading context. Place the teacher-supplied NPS distinctions between total arrivals, peak population and designed capacity beside the reading; use those explicitly labeled figures for this activity.
Sources and image credits
NPS Andersonville overview and population distinctions
VA Federal Stewardship of Confederate Dead printed page 222
Image record andersonville-stockade-replica
Image record andersonville-cemetery
Image record andersonville-museum
Product thumbnail reproduced from the exact HistoraEDU listing at the owner’s request. Historical photographs are separate evidence, not product endorsements.
