
Two genuine USGS diagrams placed in an original comparison layout. Left: The Natural Water Cycle, Howard Perlman and John Evans, USGS. Right: the diagram released in 2022, USGS VizLab. Both identified source images are public domain; thumbnails are for orientation, not label reading.
A water-cycle worksheet can be accurate and still be the wrong model for the question you have asked. If students are explaining evaporation, a natural-cycle diagram may provide the relevant connections. If they are explaining how irrigation changes water’s movement, a diagram that deliberately leaves out human influences cannot carry the whole explanation.
USGS offers both versions. The useful choice is not “old versus new” or “simple versus detailed.” It is whether the model includes the processes and relationships students need to explain. This source-based review compares the identified diagrams and provides an original selection rubric and pathway tracing sheet. It does not report a classroom trial or a measured learning gain.
Begin with a question the model can support
Write the explanation you want before choosing the download: “How could water used to irrigate a field reach the atmosphere?” That question involves a store of water, movement between stores and a human action. It gives students a reason to look for wells, fields and evapotranspiration rather than merely fill in every label on the page. Browse the USGS diagram collection.
Use the version that includes human water use
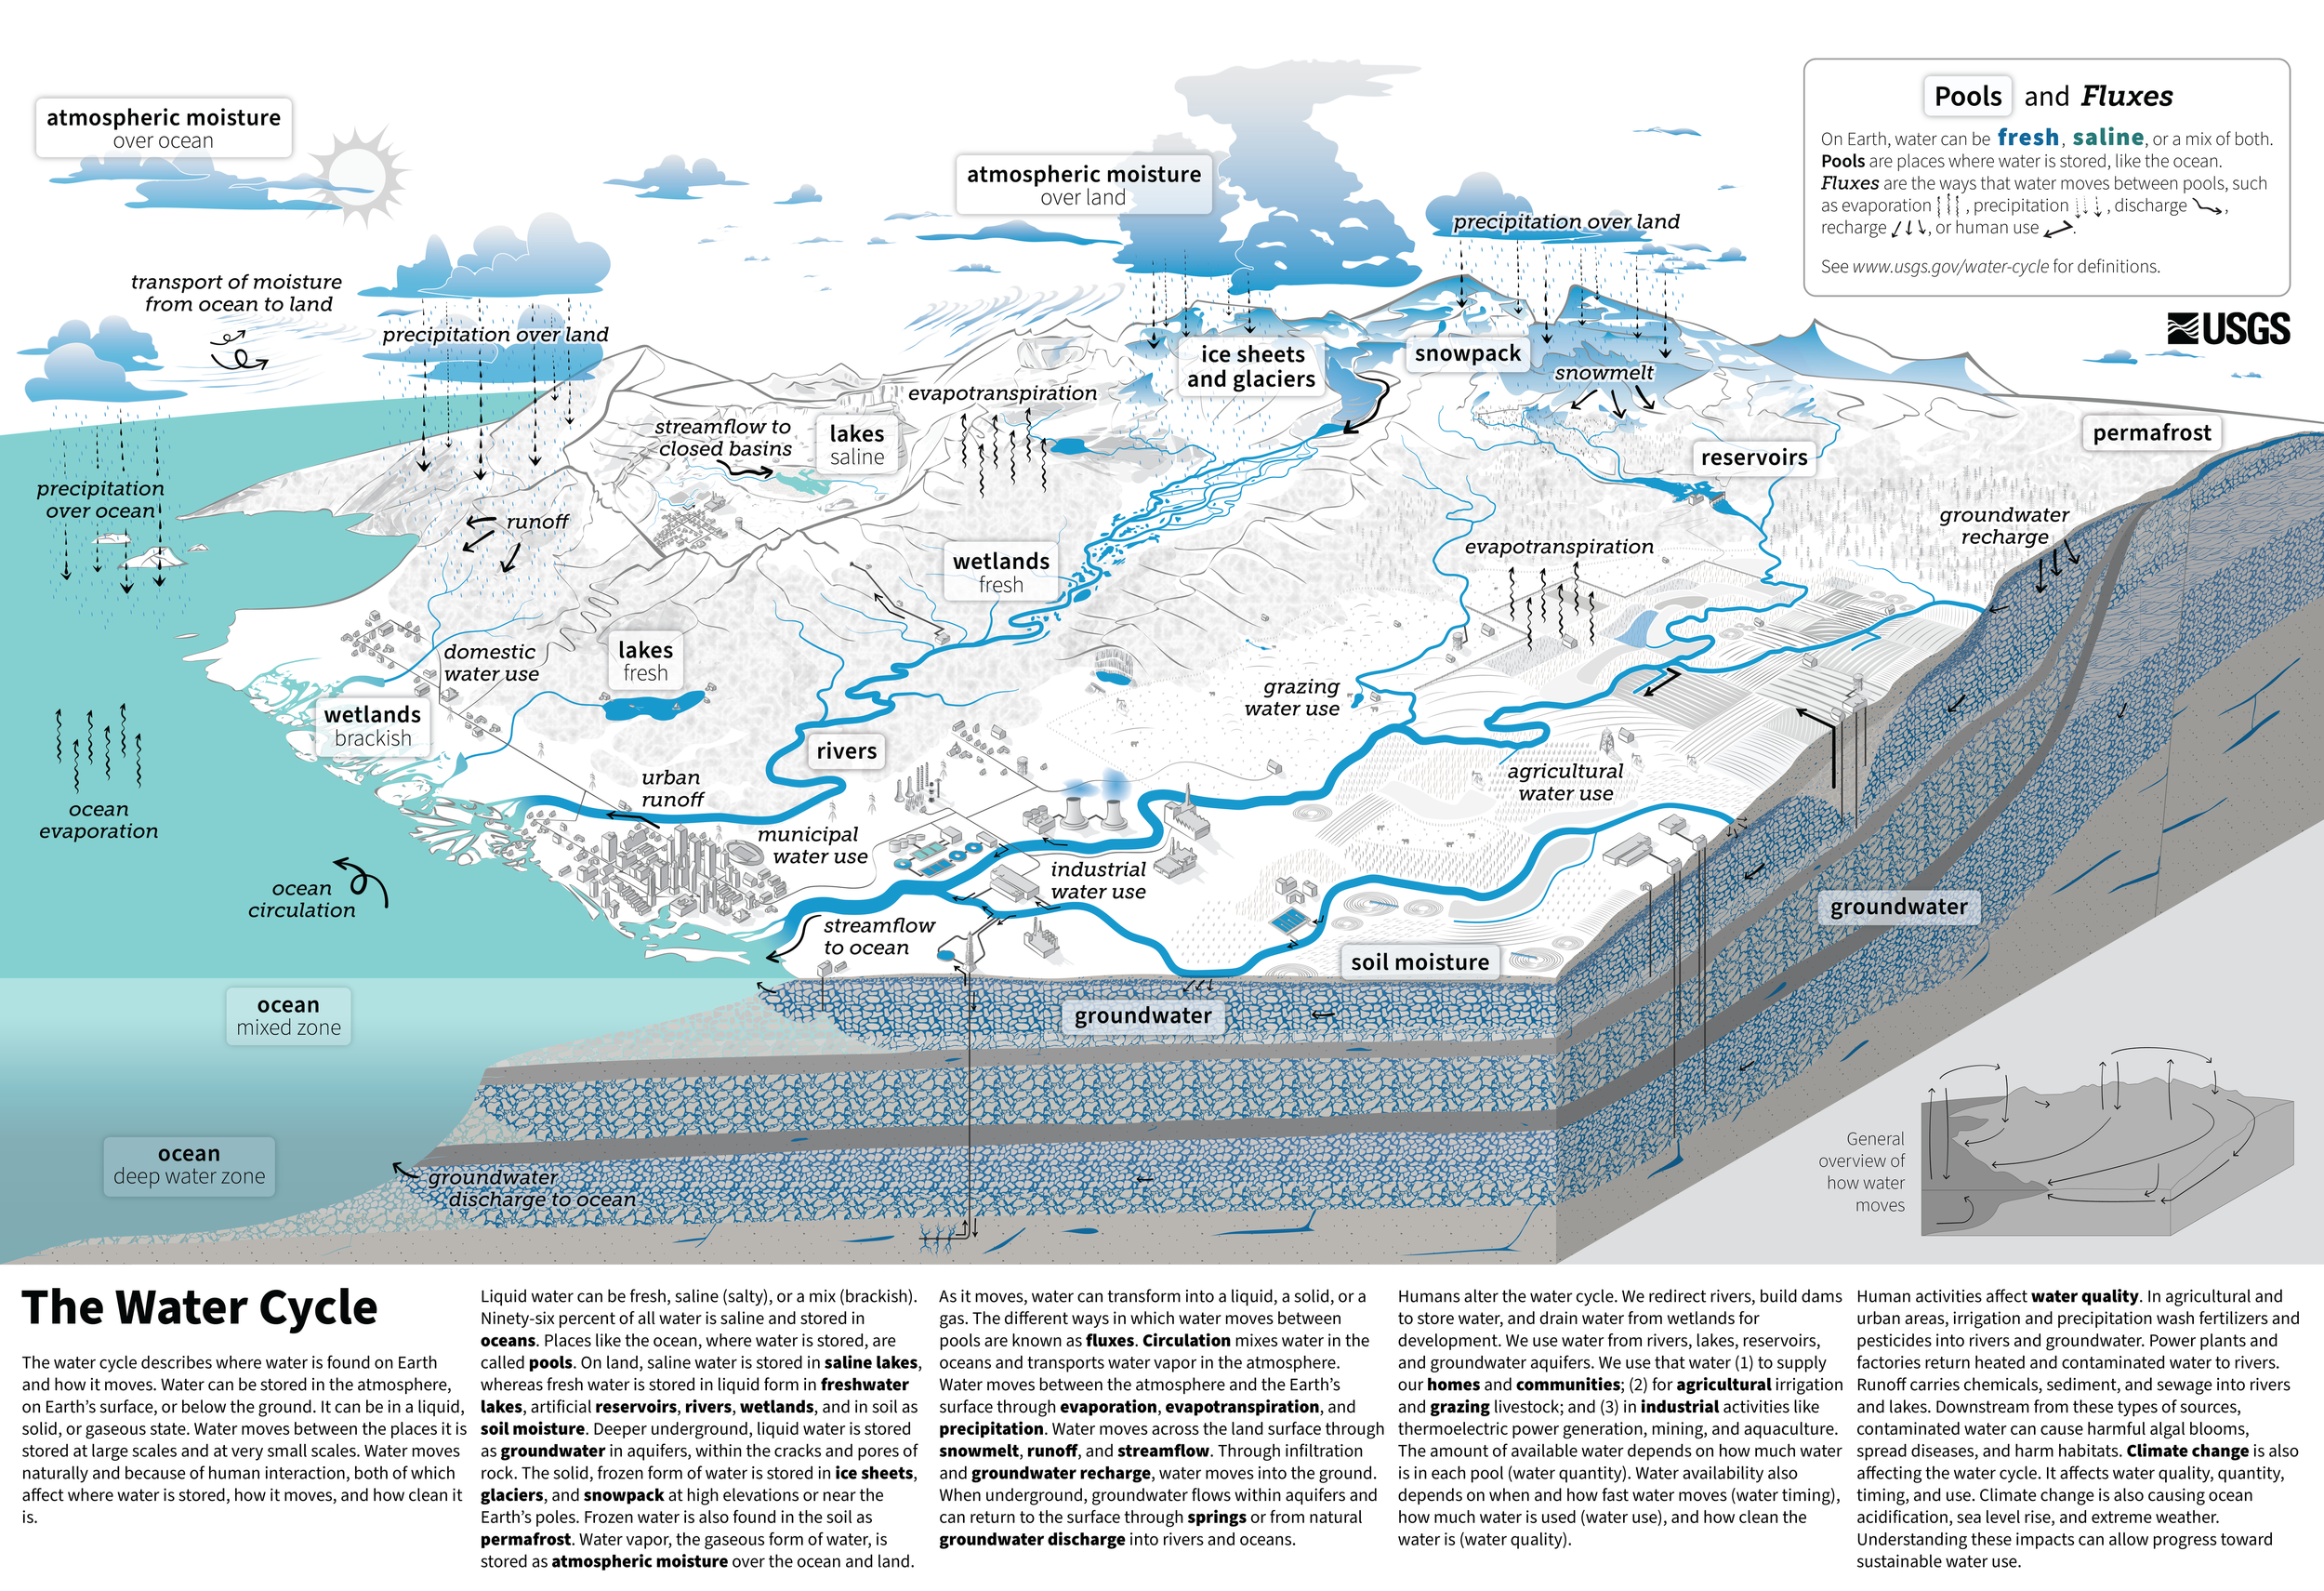
The Water Cycle, released in 2022. USGS VizLab for the USGS Water Science School. Public domain. Full diagram and supplied text retained; reduced proportionally for this document. Use the linked full-resolution original or handout to inspect small labels.
The 2022 diagram explicitly represents human uses of water alongside natural movement. Its cutaway helps locate groundwater; wells, fields, reservoirs, settlements and industry make human interactions visible. The official page offers a full-resolution image, a handout and a comprehensive text description. Those alternatives matter because fitting the entire landscape into a narrow document makes its smallest labels difficult to read. Open the exact diagram and its text description.
Ask learners to distinguish a pool, where water is stored, from a flux, which moves water between pools. Groundwater is not the same kind of label as groundwater recharge. A familiar vocabulary list can conceal that difference unless the task requires students to explain a connection.
Keep the natural version for a suitable task
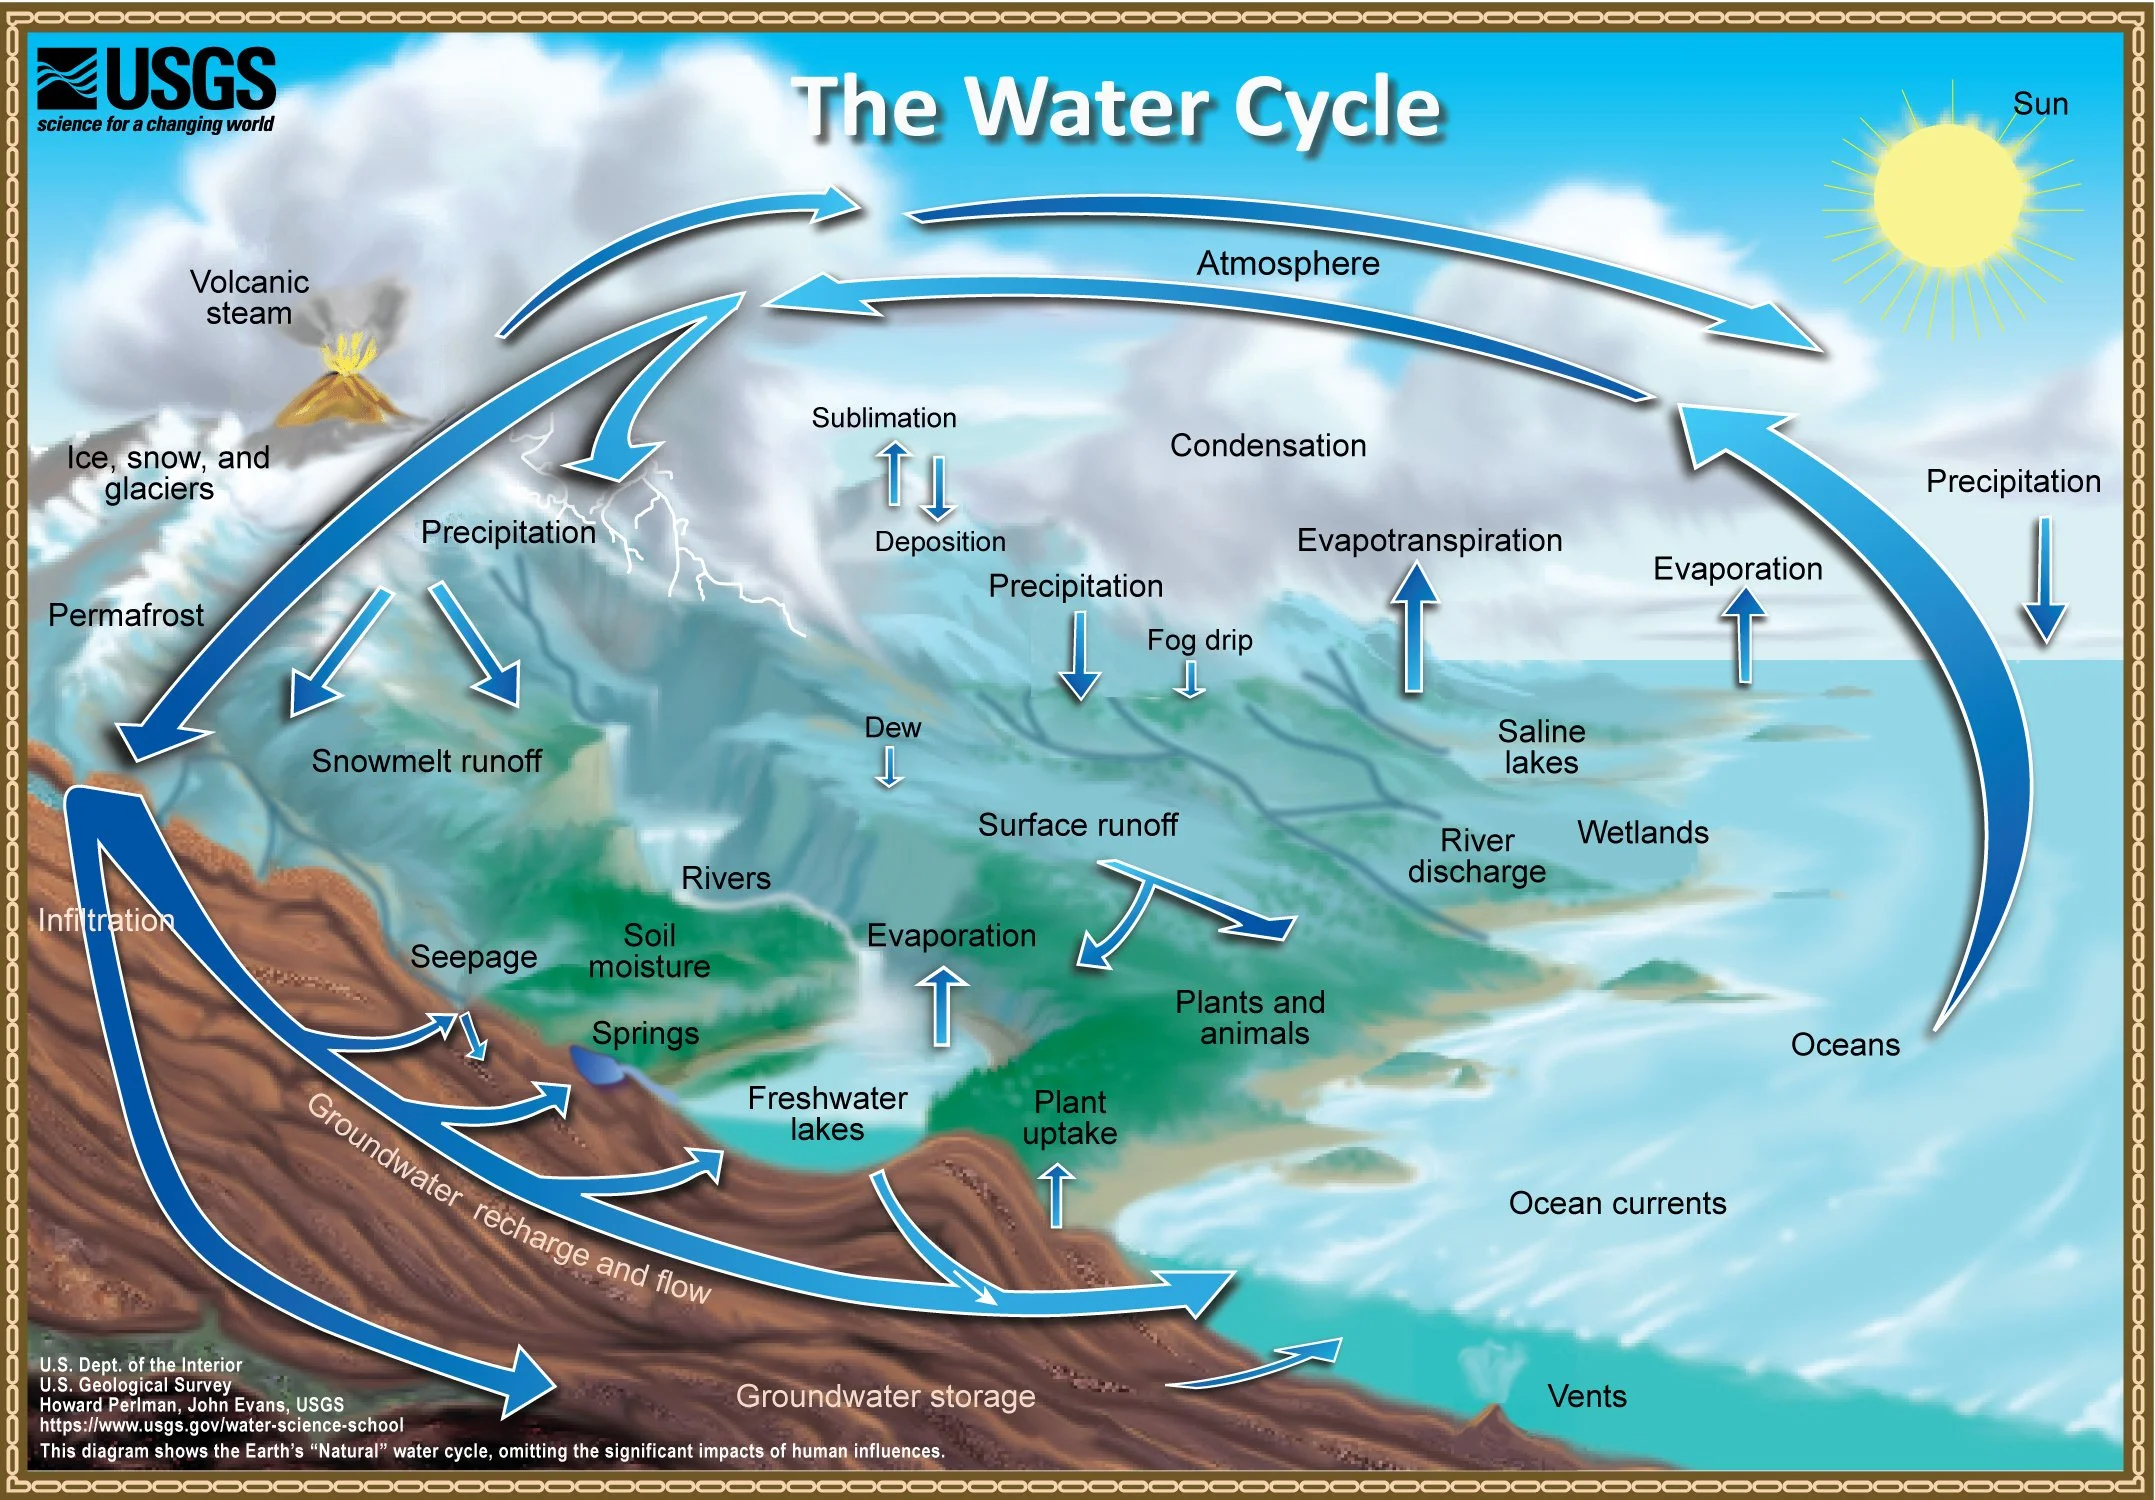
The Natural Water Cycle, Howard Perlman and John Evans, USGS. Public domain; full source image. Its own note states that the diagram omits significant human influences. This is a declared model boundary, not an invitation to call the natural processes incorrect.
The natural-cycle diagram supplies a different focus. It shows connections involving precipitation, evaporation, groundwater, surface water and other natural processes. For a question about how water moves between land and atmosphere, those features can be useful. For a question about a well supplying irrigation, the omission of human influences is consequential. See the exact natural-cycle record.
Use the pair to ask, “Which explanation can we make with each model, and which part would we need to add or find elsewhere?” Avoid scoring the diagrams by counting labels. The model with more labels is not automatically easier to use, and an unlabeled version does not by itself reveal whether students understand the relationships.
Work through one possible irrigation pathway
An illustrative explanation begins with groundwater stored below the surface. Pumping moves some of that water into an irrigation system and onto a field. Water in the soil can then move through plants and return to the atmosphere as vapor through transpiration; evaporation from land also contributes to evapotranspiration. USGS explains evapotranspiration as the combined movement through evaporation and transpiration. Read the USGS process explanation.
This is one possible pathway constructed for the lesson. It is not a claim that all irrigation water follows the same route, or that the diagram tracks a particular parcel of water. Ask students to point to the groundwater, irrigation and atmospheric parts that support the explanation, then identify any intermediate process supplied by the accompanying text rather than by a visible label.
Now inspect an incomplete response: “The well makes water for the plants.” The repair is specific: “The well withdraws water that was already stored underground.” A second incomplete response, “The water is gone after evaporation,” needs a different repair: the explanation must identify a destination and change of state. These are hypothetical teaching examples, not collected student responses.
A four-question selection rubric
First, does the model include the process in the prompt? For our irrigation question, the well and agricultural water use matter. The natural version needs another representation or explanation for that part.
Second, can learners distinguish storage from movement? Ask them to name one pool and the process that transfers water from it. A response that lists “groundwater, pumping, clouds” without explaining the links is not yet a pathway.
Third, what would require data rather than a diagram? Neither of these landscapes supplies the pumping rate, the amount reaching the atmosphere, the travel time or a forecast for a particular farm. Do not turn arrow width or drawing size into an unsupported numerical estimate.
Fourth, can students inspect the relevant detail? Select a readable handout or full-resolution view, and provide the official text description. If you isolate a detail for instruction, label it as a detail and keep the full model available. Do not silently remove processes and present the result as the unchanged USGS diagram.
Trace the pathway and name the limit
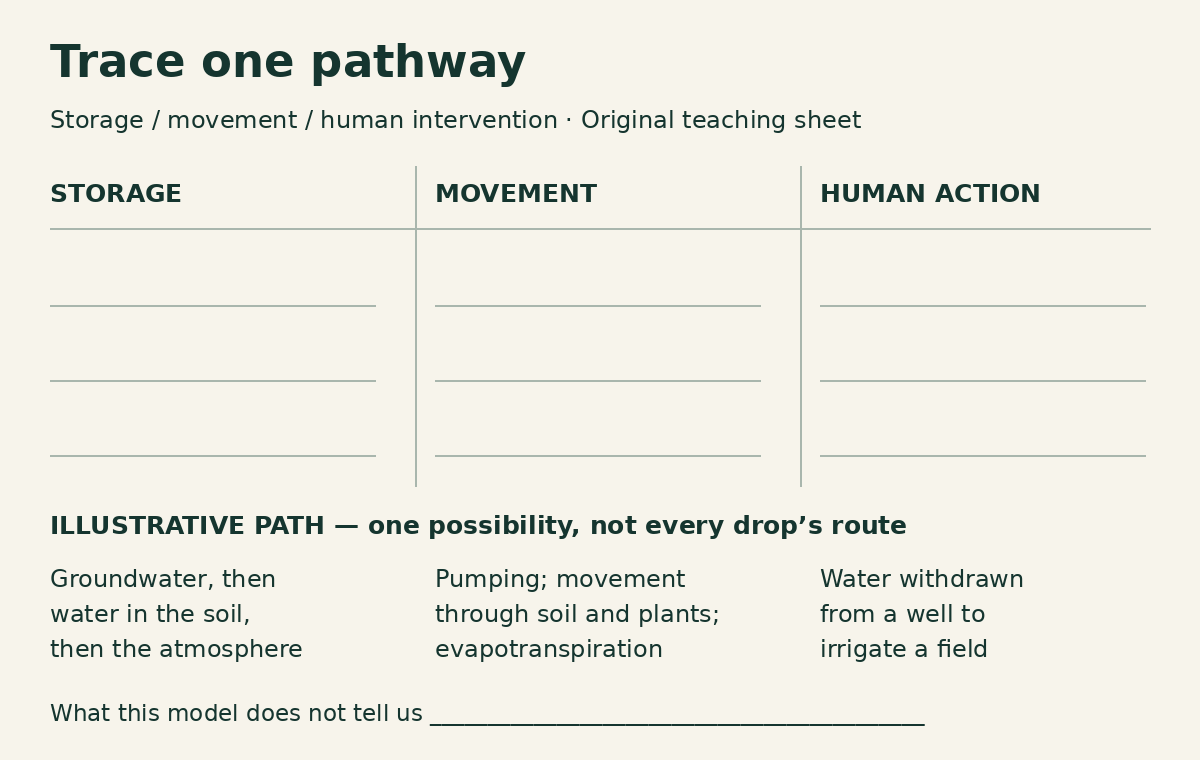
Original tracing sheet by The Instruction Edit. The example is one possible irrigation pathway, not a USGS worksheet or a record of a real farm.
Use three headings in a notebook or editable document: Storage, Movement and Human action. Students can record the source version above them, then trace a route in words. Finish with a fourth prompt: “What would we need to know to answer this for a particular place?” For the worked case, useful missing information includes the source of irrigation water, local conditions and quantities over time.
The diagram’s value is its explanatory scope. It helps make human action visible within the water cycle, but it does not replace local evidence or turn every arrow into a measured flow. The USGS overview also emphasizes that human actions affect storage, movement and water quality. Use that framing to keep the explanation broader than a loop of four memorized words. Read the USGS water-cycle overview.
Trace one water pathway and record which parts the selected model cannot answer. Keep the version and source with the response so another reader can see exactly what the model contributed.
Non-affiliate resource evaluation. Both reproduced USGS image records state Public Domain; credits and full source context are retained. No USGS endorsement is implied. Sources checked October 30, 2026.
