
Header credit: NOAA/NCEI. Genuine content-only resource screenshot, October 30, 2026; no agency endorsement implied.
“Warmer than normal” leaves an important question unanswered: normal for what place, variable and period? A November average should not be compared with an annual average, or a station’s mean temperature with a map of maximum temperature. Before calculating a difference, write the baseline in words.
NOAA’s U.S. Climate Normals resource is useful for that selection problem. Its standard reference periods span 30 years; the current conventional period is 1991–2020. The resource also offers other periods and different time resolutions. Those choices are not interchangeable labels on the same answer. This is a documentation-based evaluation with genuine page captures, not a classroom trial or a verified local-weather query.
Read the access choices as part of the task
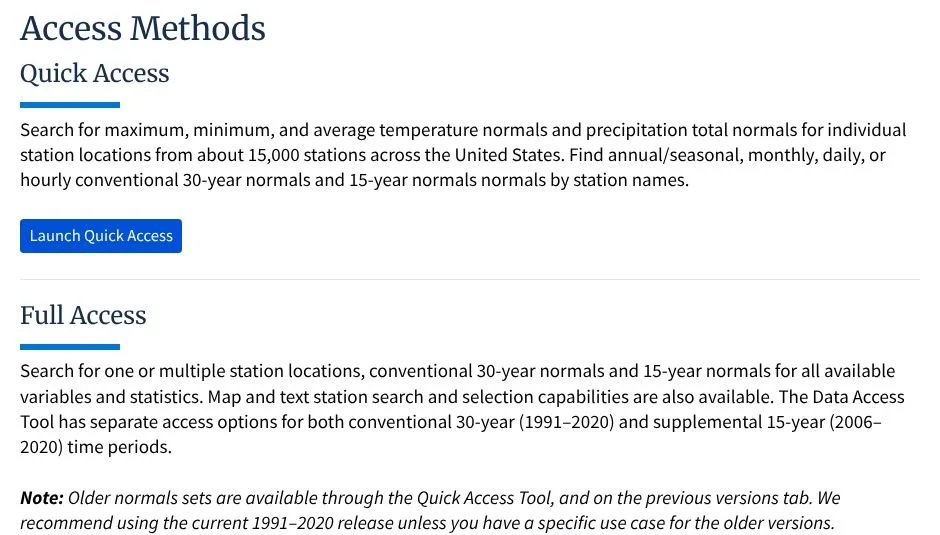
Figure 1. Genuine excerpt of NCEI’s Data Access panel: Quick Access and Full Access, with conventional 30-year and supplemental 15-year periods distinguished. Unaltered page content; screenshot selection only. Source: NOAA/NCEI.
Quick Access is a convenient starting point for common station variables. Full Access documents a broader selection of variables and statistics. A teacher investigating one named location should save the station identifier as well as its readable name: a city label is not a guarantee that two records describe the same observing site.
We opened the Quick Access entry page and observed its dataset, period and station-selection controls. We did not complete or verify a station query. NCEI’s product page displayed a cloud-migration notice about intermittent data-access delays. Prepare a saved, documented example before assigning a live search; do not turn a loading failure into invented results.
For a November comparison, first select the November statistic that matches the observation. Record whether the value is mean temperature, average maximum temperature or another quantity. Preserve the units. A familiar-looking number without those labels is not ready to support a classroom claim.
Station, grid or period comparison?
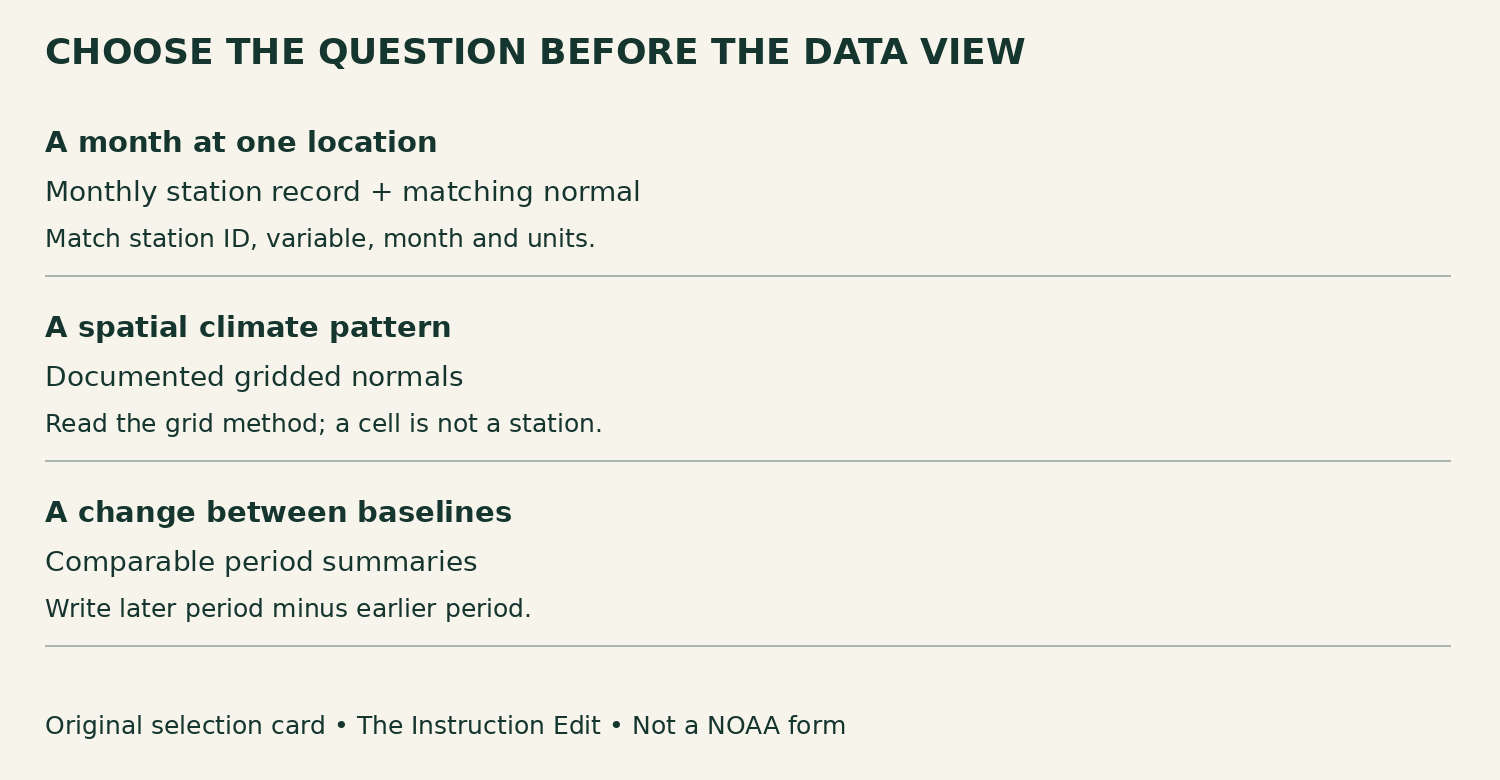
Figure 2. Original question-to-data decision card, The Instruction Edit. This is a planning aid, not an official NOAA interface or form.
Use a station record when the question concerns the documented conditions at that observing location. Use a gridded product when the question concerns a spatial pattern, and read its documentation. NCEI explains that its monthly grids are created from station data through interpolation. A grid cell is not a thermometer installed at every point it represents.
For a baseline comparison, keep the variable, geographic support and period aggregation comparable. Do not silently compare one station with a regional grid average. Check the product versions and method notes as well: the Quick Access page cautions that the legacy 1981–2010 period used earlier data and methods. A changed baseline is not automatically an isolated change in climate alone.
The resource’s published comparison maps can help frame a spatial question. In this article we link the official comparison section rather than reproduce its map: the proposed map carries a cooperative-institute credit, so NOAA-only public-domain assumptions were insufficient for that image. The genuine screenshots here contain only NCEI’s own resource text, not that map or its partner branding.
A worked calculation is not a rarity test
Consider an explicitly fictional teaching example, not a NOAA station result. A November mean temperature is 12°C. A matching November normal is 10°C. The departure is 12 − 10 = +2°C. If the same observation is compared with a different, explicitly identified normal of 11°C, the departure becomes +1°C. The observed month has not changed; the reference has.
A defensible sentence is: “In this invented example, the November mean is 2°C above the stated November normal.” It is not yet: “This was an exceptionally rare month.” To judge rarity, the learner needs information about the distribution of comparable months and an explicit criterion. A mean alone does not show how widely individual months vary.
Nor is a normal a promise that every November, or every November day, will have that value. A climatological baseline can inform planning without being a day-specific weather forecast. Ask learners to separate three outputs: the observation, its departure from a named baseline, and any additional evidence needed for an unusualness claim.
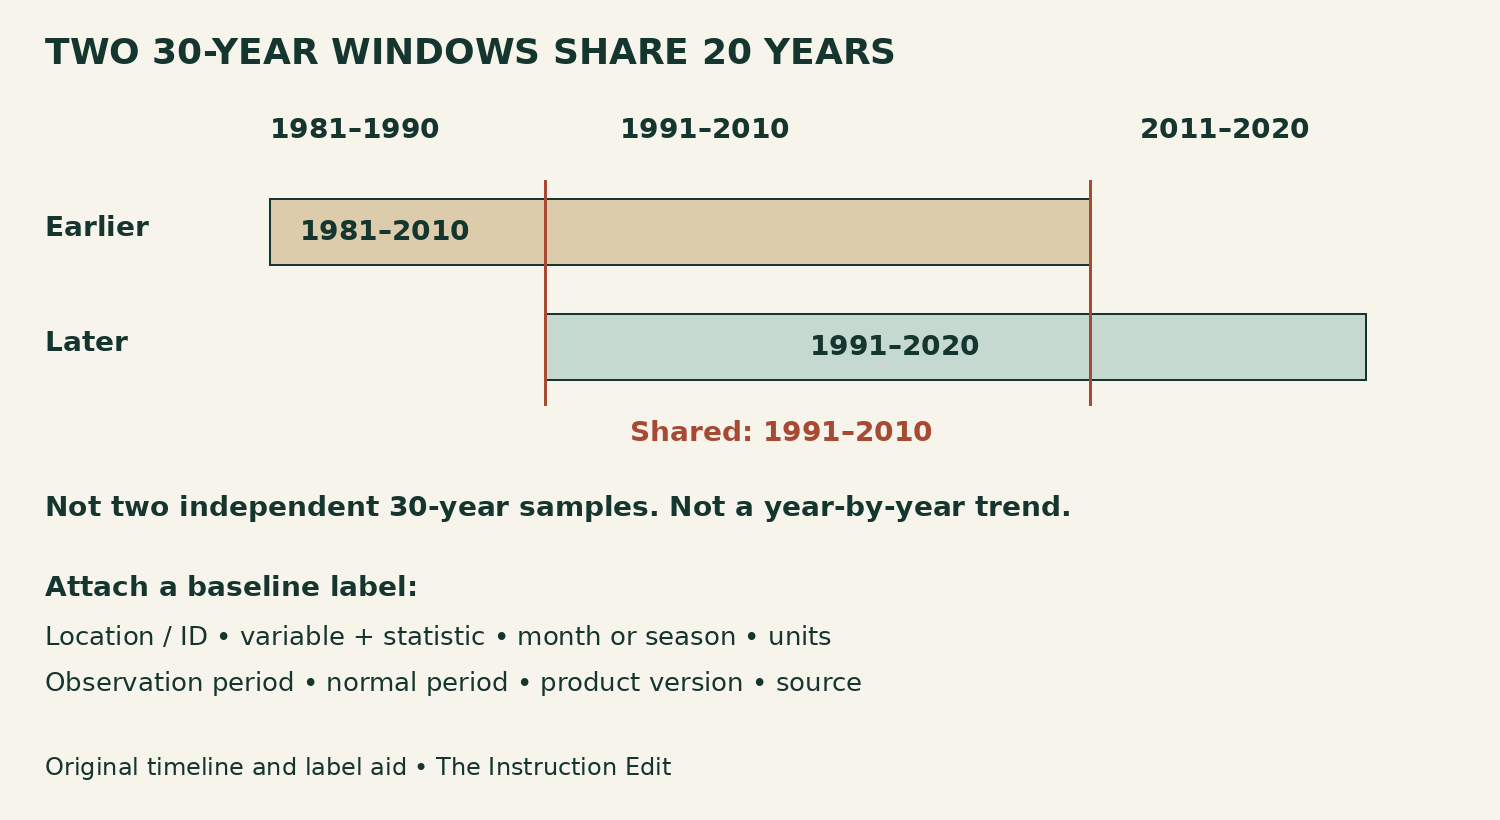
Figure 3. Original overlap timeline and baseline-label aid, The Instruction Edit. The windows share 1991–2010, a 20-year overlap. The timeline is not a temperature graph.
Keep the overlap and the label visible
The 1981–2010 and 1991–2020 windows each contain 30 years, but they share 20. They are not two independent 30-year samples. Comparing their averages replaces one decade with another while retaining the common years; it is not the same operation as fitting a trend to all annual observations. The timeline makes that distinction visible before students interpret a difference.
Attach this label to a selected resource: location and identifier; variable and statistic; calendar month or season; units; observation period; normal period; product version; and source. If a value is missing or a method is unclear, record the gap and the next check. Do not let a clean graphic conceal an unresolved comparison.
For the fictional example, a useful label begins “Teaching example, not observed data; November mean temperature; °C; observation 12; normal 10; departure +2.” A real version must replace those invented entries with a documented location, periods and source values. Keep the example visibly separate from the NOAA screenshots.
The specific text-only NOAA/NCEI captures are reused with attribution under NOAA Library’s guidance for NOAA-only material. No third-party comparison map or agency emblem is republished in these captures. Our decision card, timeline and calculation are original and are not NOAA-authored or endorsed. We have not audited live data fulfillment or assistive-technology access.
Sources and next step
NOAA/NCEI: U.S. Climate Normals product documentation and Quick Access entry page. NOAA Library: Copyright of NOAA’s published works. Checked October 30, 2026. Non-affiliate evaluation.
Add the variable, location, period and units to the next climate graphic you use. Then ask whether it establishes a departure, a spatial pattern or a claim that still needs more evidence.
