
Featured image: Source satellite images, NASA Earth Observatory, Terra/MODIS, World of Change: Shrinking Aral Sea. Layout and external labels: The Instruction Edit. No NASA endorsement implied.
Two images can make a change easy to notice and its explanation too easy to invent. A large green-blue area in one view and exposed ground in another invite a story. But the comparison does not, on its own, identify the decisions, river flows or weather that produced the difference.
NASA’s World of Change: Shrinking Aral Sea is useful precisely because it offers more than a dramatic pair. It contains a dated series, an explanatory account and source imagery from Terra’s MODIS instrument. Decide which of those layers your question needs. This article evaluates the published resource and proposes an original classroom task; it does not report classroom testing or a new remote-sensing analysis.
Use the endpoints for a bounded observation
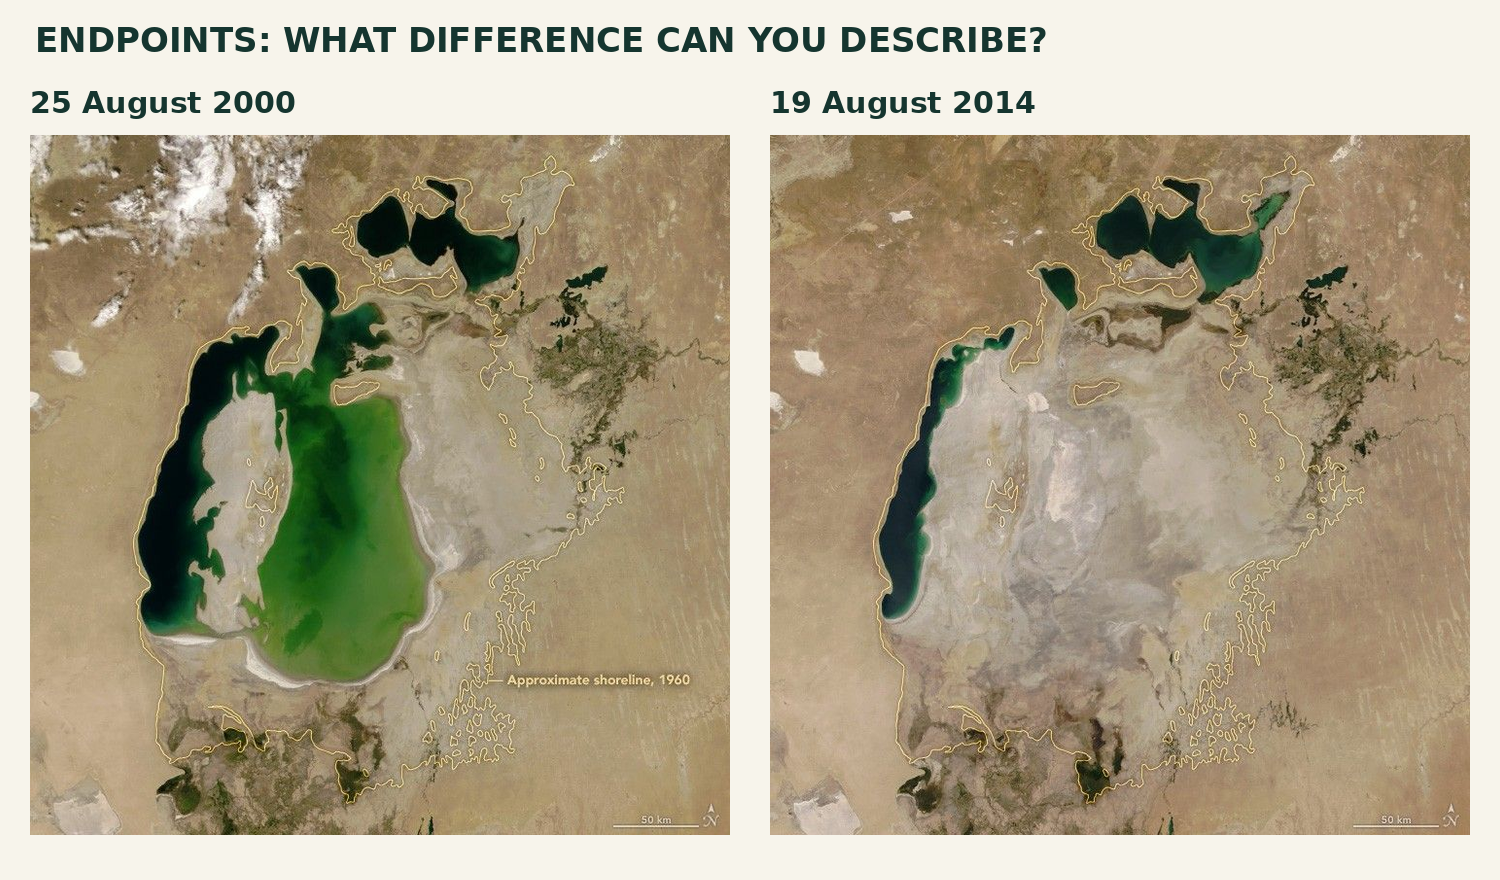
Figure 1. The 25 August 2000 and 19 August 2014 frames, NASA Earth Observatory. Source images unchanged; dates added outside the frames. Yellow outlines mark the approximate 1960 shoreline, not the water boundary on either acquisition date.
Give learners a location before asking for a difference: the eastern lobe of the South Aral Sea, to the right of the long western lobe in these north-up views. A defensible observation is that the broad water-covered eastern area visible in 2000 is absent in the 2014 frame. Keep the remaining northern and western water bodies in the sentence’s scope; “the entire Aral Sea disappeared” is not what this pair shows.
The yellow line is a supplied historical reference overlay. It is not a shoreline independently observed in 1960 by this satellite pair. The 50-kilometre bars help establish spatial context, but a classroom visual comparison is not an area calculation. Do not turn the number of colored pixels on a resized slide into a measured loss of water volume.
Use these endpoints when the target is describing where change is visible. If the question asks whether the lake shrank continuously, or why it changed, the pair is insufficient. That is a resource-selection decision, not a failure of the photographs.
Add an interval that challenges the easy story
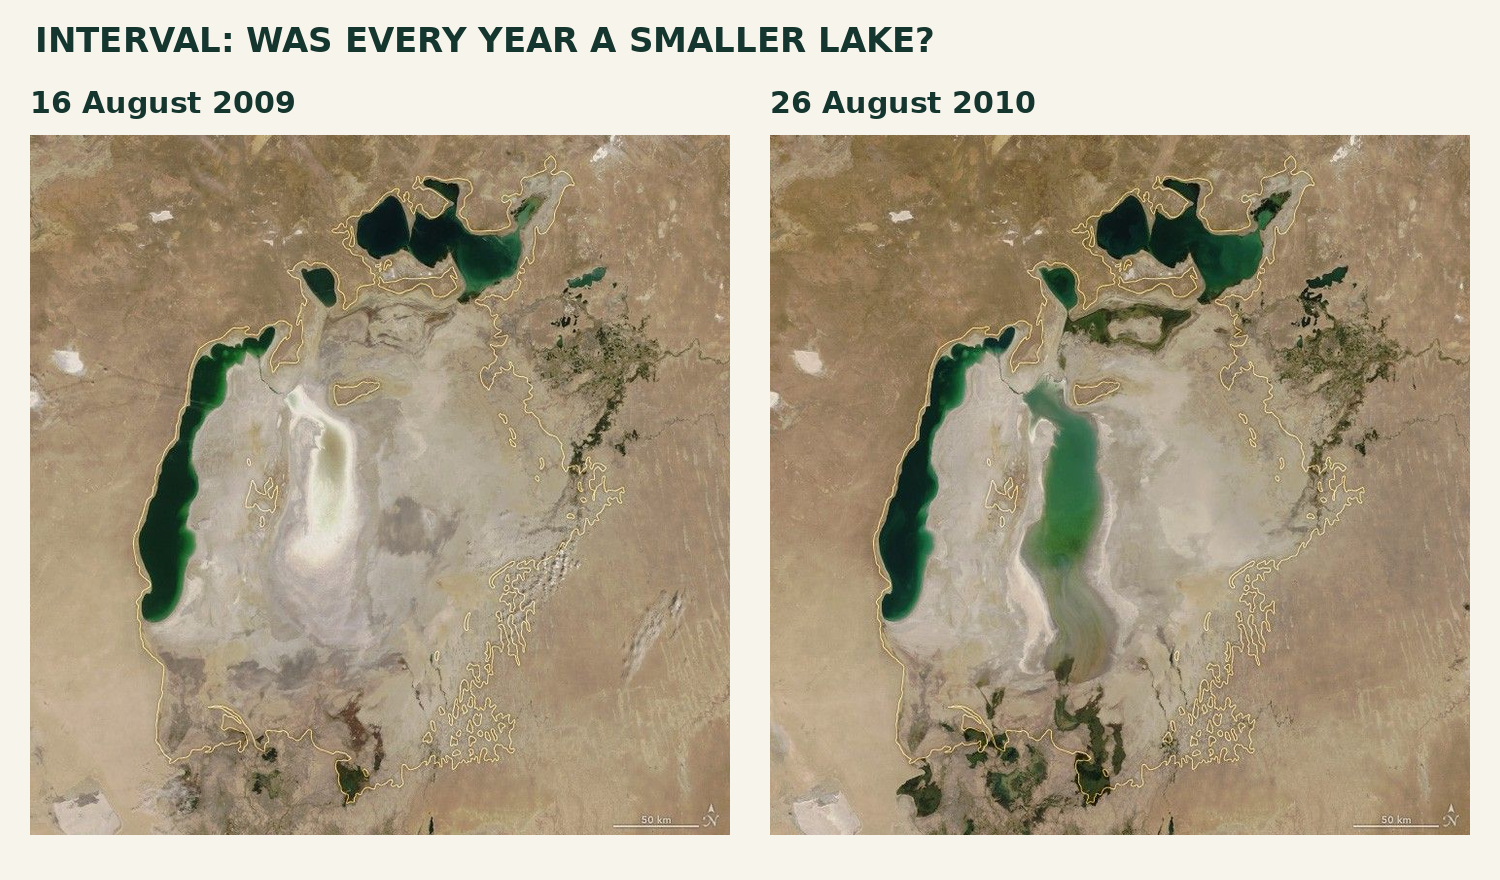
Figure 2. The 16 August 2009 and 26 August 2010 frames from the same World of Change resource. The eastern lobe appears much more water-covered in the later view. Full source frames and their scale bars retained.
Ask learners to test a specific proposition: “Every later image shows less water in the eastern lobe.” The 2009–2010 comparison challenges that proposition. This is a better use of extra images than simply adding more examples of the endpoint contrast. A sequence can expose a reversal hidden by the first and last frames.
All four selected acquisitions are in August, but not on the same day or under identical conditions. Check cloud cover, the geographic window, scale and the appearance of shallow water before deciding what can be compared. Water color is not a direct reading of pollution; the World of Change account identifies sediment and depth as influences on color. We have not classified pixels or checked raw satellite data here.
The 2014 explanatory article describes the 2009 retreat and 2010 rebound, and discusses reduced precipitation and river inflow alongside continuing irrigation withdrawals. That is an explanation source to examine, not a cause visible in the image itself. It supplies a different evidential layer, though it is from the same institution—not an independent replication.
Keep observation and explanation in separate fields
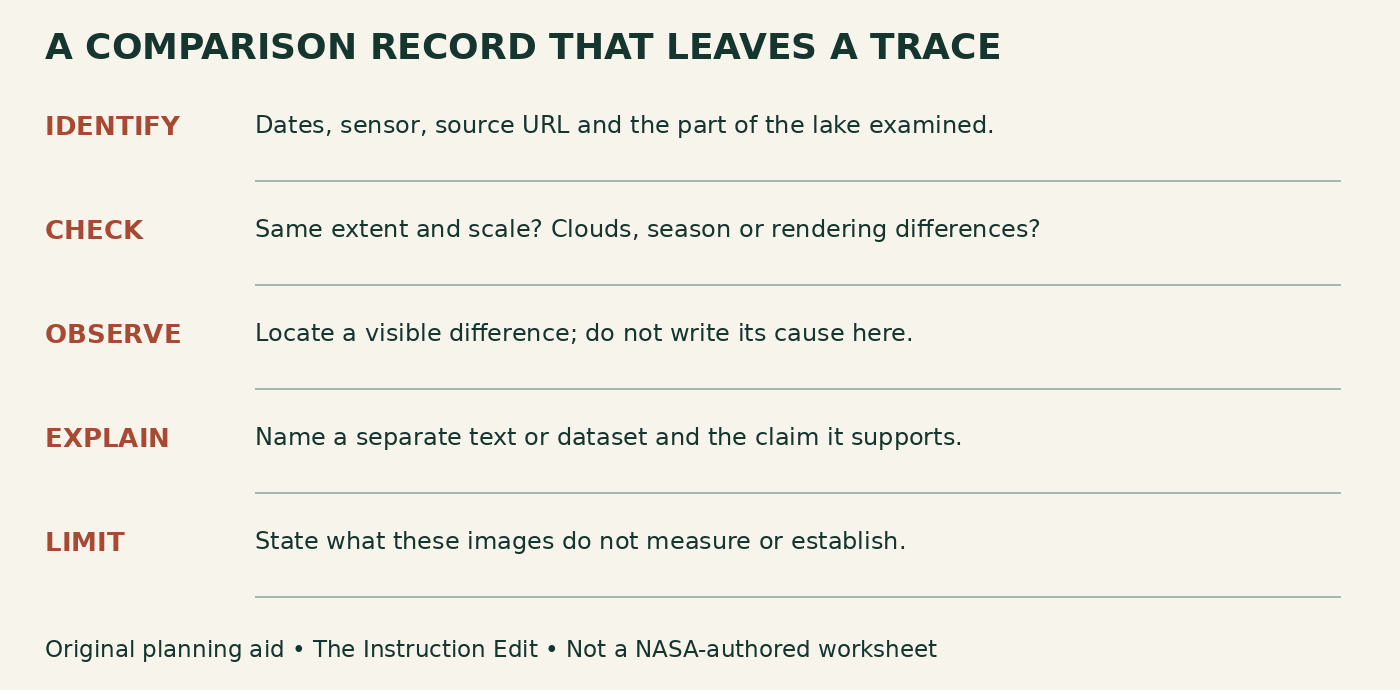
Figure 3. Original image-comparison protocol, The Instruction Edit. Use the same record for an endpoint pair and an intervening pair; revise the claim when the additional evidence warrants it.
A worked record might read: “I compared 25 August 2000 with 19 August 2014 in the eastern South Aral lobe. The source frames use the same displayed geographic window and 50-km scale bars. The visible water-covered area is substantially smaller in the later frame. These views do not measure water volume, identify a single cause or show what happened in every intervening year.”
Then add a separately attributed explanation note: “The linked 2014 Earth Observatory account discusses irrigation withdrawals and reduced river inflow associated with lower rain and snow.” Ask what further evidence would test that account: dated discharge records, precipitation observations and water-management records, for example. Those are proposed corroborating sources, not datasets supplied or analyzed in this article.
Finally, append the interval check: “The August 2009–2010 pair shows that the eastern lobe’s visible extent can increase between selected dates. My endpoint observation still stands; my claim of continuous shrinkage does not.” The task is to revise the claim’s scope, not to explain away inconvenient evidence.
Choose the version your lesson can support
For a brief observation task, use the two endpoints with dates, full geographic extent and a text description. For a sequence task, add the intervening pair and ask what claim it challenges. For a causal explanation, provide the explanatory reading and at least a plan for corroborating evidence. More frames alone cannot substitute for a causal account.
The resource’s strengths are its recognizable place, consistent comparative framing and linked narrative. Its limits matter just as much: selected dates are not continuous monitoring; an overview image is not a precise measurement dataset; and the 2000 starting point is already long after major diversion began. Do not label it an undisturbed “before” condition. The full published sequence extends beyond the 2014 endpoint selected here.
Keep the original colors, full frames, dates and embedded scale/context markings. For nonvisual access, describe the named region and the observed contrast, then provide the same explanatory text and uncertainty question. Our literal image descriptions and protocol are supplied for adaptation; no assistive-technology or live-interface audit is claimed.
These exact NASA-hosted source images have no third-party copyright marking on their resource page. NASA Earth Science permits reuse, including commercial reuse, unless copyright is indicated. Credit NASA Earth Observatory; keep the factual educational context and do not imply NASA review or endorsement. The protocol and conclusions here are The Instruction Edit’s work, not NASA-authored teaching material.
Sources and next step
NASA Earth Observatory: World of Change sequence; acquisition-date index; The Aral Sea Loses Its Eastern Lobe. NASA Earth Science reuse FAQ and NASA image-use guidance. Checked October 30, 2026. Non-affiliate evaluation.
Write one observation the images support and one claim they cannot establish alone. Then choose the next source because it answers that gap—not because it makes the slide more dramatic.
